As gold has broken above its $1300 resistance, enthusiasm for the miners is still at the back-burner. We are miles away from the collective euphoria witnessed only little over a year ago.
Graphs were updated on Oct 10, 2017.
The miners rally after end January 2016 has been almost miraculous, with the HUI index more than doubling over less than six months. After mid August 2016 however, much of the gains evaporated. That didn't come as a surprise because gold slid back down to around $1130 by mid December 2016, from its 'lofty high' over $1360/oz both in the second week of July and early August 2016.
The time scale extends from July 2013, as gold started recovering after its major slide since April 2013 till the present day. 28 points on the HUI index matches a $50 variation on the gold price. One very important observation though: the 'zero level' on the HUI would match to a reading of $900/Oz for gold.
This fresh rule must then be approximated by: HUI = 0.56 * (Gold price - $900)
This essentially makes the relationship non-proportional and implicitly assumes that a gold price below $900/oz would imply the gold miners to go out of business. A disclaimer not without any reason: there is no such clear 'cut-off' gold price for the mining industry. The level of the USD-index highly affects mining costs for the majority of gold producers outside the US. Moreover, gold producers have vastly different margins and most probably also high margin differences among their individual gold mining sites. Yet a rule with only two parameters is most elegant ... while the current correlation holds.
A (least square) regression analysis provides you with mathematically exact values. For such least squares linear regression, we opt to extend the interval of the gold slide from about $1800 to the $1050 bottom early December 2015. To cover this interval, we need including data going back to the summer of 2012, before gold failed its last attempt to break above $1800 early September 2012. Any time interval chosen necessarily yields a slightly different set of parameters, however including these earlier data even improves the correlation coefficient to 0.968. This corroborates the analysis results.
In a regression analysis, dates are eliminated: it shows the HUI values relative to the gold price. All blue dots are given (HUI, Gold) couples for any given date between July 1, 2012 and July 12, 2017.
Note: The regression made is y-values: Gold price on x-values : Hui index. It provides the intercept on the gold price axis and the inverse value of the slope of HUI relative to gold.
Using these data, the slope and intercept are 0.563 and $895, turning the HUI dependency on gold into
Why we don't include any data going back to the September 2011 gold price all time high also proves obvious. Those earlier data couples are shown in orange. When checking carefully (clicking the graph for full resolution), those data points are in a cloud at the upper right, systematically above the points since July 2012. Including those data tilts the regression line higher, but it deteriorates the correlation coefficient.
Below we apply the linear regression parameters obtained since summer 2012 to HUI and Gold data since January 2011, before the yellow metal steamed up to its $1900 all time high. This illustrates that the HUI index has been moving sideways for most of the gold rally from about $1400 at the end of 2010 to the gold all time high about nine months later. Miners lagging the metals has been the rant since 2010. While recovering from the financial crisis the HUI failed to gain the "Gold Price / 2" empiric trading rule that had been observed from about 2004 till gold first broke above $1000 in March 2008.
As gold was sliding away from its ATH, the metal found short term support at around $1560/Oz, with later gold rallies failing at $1800. The HUI index started mimicking the gold price and the HUI/Gold regression was established as the new rule of thumb during summer 2012.
While the trend line gives an overall decent fit, data points in the intermediate area are scarce and seem to concentrate on the downside, while the data cloud at the right is quite extended. For a meaningful explanation, we need to introduce the dates once again, showing the 'residuals' as a function of time. These distances from the least squares trend graph are shown as a function of time on the below graph:
Residuals are oscillating around the trend line. In 2012-13 the amplitude of the oscillations used to be quite large, giving rise to the more extended data cloud preponderant at higher gold prices. After the gold price slide, their amplitude was reducing in 2014-2015. The narrowing of the data cloud was however temporary. Below you find the more recent data.
In October 2015 miners ignored the temporary gold recovery and residuals went negative. Yet they reverted course and became positive before gold eventually bottomed at $1050/Oz early December 2015. With gold dragging above its bottom throughout December, residuals slid and became negative into 2016. As gold eventually started its recovery after mid January, residuals slid even deeper, indicating that gold miners reluctantly followed gold. The lack of enthusiasm among mining investors was comparable to that during the fake October 2015 recovery. Sentiment would only start improving after mid February and it lasted till early April 2016 before any positive reading on the residuals confirmed that the recovery trend was picking up steam, finding acceptance among a larger number of investors.
Residuals remained positive from mid May 2016 (despite a late June plunge) throughout August 23. By mid August gold had started weakening, with the slide accelerating towards the end of the month. This eventually killed miner enthusiasm. Residuals remained negative after Aug 30 till Oct 12, later on they have been oscillating between +10 and -10 (more or less market neutral). Yet from mid November onward, miners have been anticipating the gold recovery has been materializing earlier. Miner sentiment peaked early January 2017. As gold strengthened till end February, enthusiasm for miners waned and residuals briefly turned negative. During the April gold recovery, peaking at $1280, miners kept lagging the yellow metal and residuals again turn negative, with little change as gold was weakening to around $1250. With gold unable to hold on to any substantial gain, miners are languishing. Sentiment even went sour as gold failed a last attempt to break above $1300 early June and residuals slid below -20. Remarkably residuals improved and returned to a neutral stance by mid June. After bottoming before mid July 2017, the gold price is recovering with miners following reluctantly. From a neutral stance, residuals plunge to -38 as gold eventually was peaking at $1350.
Residuals were approaching a neutral stance as gold turned around early October. Yet as the rally unfolds, miners once more lag the yellow metal and residuals slide back deeper into the red.
A persistent negative reading sometimes is the prelude for a slide of the gold price. A 'textbook example' is shown in the graph below, where the residuals are plotted together with the gold price before and after the hectic gold sell-off in April 2013 continuing to June 2013.
Graphs were updated on Oct 10, 2017.
The miners rally after end January 2016 has been almost miraculous, with the HUI index more than doubling over less than six months. After mid August 2016 however, much of the gains evaporated. That didn't come as a surprise because gold slid back down to around $1130 by mid December 2016, from its 'lofty high' over $1360/oz both in the second week of July and early August 2016.
Matching the HUI miners index to the gold price graph
Let's start off with a graph scaled to match the Gold price (left axis) to the HUI miners index (right axis). |
| Gold (red, left scale in USD/Oz) and HUI (blue, right scale); Data till Oct 10, 2017 - click to enlarge |
The time scale extends from July 2013, as gold started recovering after its major slide since April 2013 till the present day. 28 points on the HUI index matches a $50 variation on the gold price. One very important observation though: the 'zero level' on the HUI would match to a reading of $900/Oz for gold.
This fresh rule must then be approximated by: HUI = 0.56 * (Gold price - $900)
This essentially makes the relationship non-proportional and implicitly assumes that a gold price below $900/oz would imply the gold miners to go out of business. A disclaimer not without any reason: there is no such clear 'cut-off' gold price for the mining industry. The level of the USD-index highly affects mining costs for the majority of gold producers outside the US. Moreover, gold producers have vastly different margins and most probably also high margin differences among their individual gold mining sites. Yet a rule with only two parameters is most elegant ... while the current correlation holds.
Least squares regression
Parameters in the above equation were rounded to make major divisions on the left (Gold) and right (HUI) axis coincide. Both the gold slide during the latter part of the bear market as the subsequent 2016 recovery are well matched by the concurrent plunge followed by the magnificent rally of the miners. The same accounts for the correction we have witnessed since mid August 2016, whereby recovery gains eventually may be at stake.A (least square) regression analysis provides you with mathematically exact values. For such least squares linear regression, we opt to extend the interval of the gold slide from about $1800 to the $1050 bottom early December 2015. To cover this interval, we need including data going back to the summer of 2012, before gold failed its last attempt to break above $1800 early September 2012. Any time interval chosen necessarily yields a slightly different set of parameters, however including these earlier data even improves the correlation coefficient to 0.968. This corroborates the analysis results.
 |
July 2012 to Sep 2017: Gold - HUI spread (blue dots) and regression trend line (red). (click to enlarge)
'Early' September 2011 to June 2012 (Gold, HUI) values are shown in orange.
|
Note: The regression made is y-values: Gold price on x-values : Hui index. It provides the intercept on the gold price axis and the inverse value of the slope of HUI relative to gold.
Using these data, the slope and intercept are 0.563 and $895, turning the HUI dependency on gold into
HUI = 0.563 * (Gold Price - $ 895)
Why we don't include any data going back to the September 2011 gold price all time high also proves obvious. Those earlier data couples are shown in orange. When checking carefully (clicking the graph for full resolution), those data points are in a cloud at the upper right, systematically above the points since July 2012. Including those data tilts the regression line higher, but it deteriorates the correlation coefficient.
The paradigm shift
During 2011 - when the HUI failed to catch up with the gold price steaming up to its August/September all time high - the HUI/Gold relationship was undergoing its major paradigm shift. The linear regression between HUI and Gold (previously also called the 'bear-market logic') only set in after gold made a few more failed attempts to break and hold above $1800. It also implies the typical mining investor concept 'optionality'. After gold prices had been heavily under pressure, the first part of the gold recovery causes an upswing among miners. The increase of revenues immediately transmits to the earnings bottom line, hence causing the miners rally.Below we apply the linear regression parameters obtained since summer 2012 to HUI and Gold data since January 2011, before the yellow metal steamed up to its $1900 all time high. This illustrates that the HUI index has been moving sideways for most of the gold rally from about $1400 at the end of 2010 to the gold all time high about nine months later. Miners lagging the metals has been the rant since 2010. While recovering from the financial crisis the HUI failed to gain the "Gold Price / 2" empiric trading rule that had been observed from about 2004 till gold first broke above $1000 in March 2008.
As gold was sliding away from its ATH, the metal found short term support at around $1560/Oz, with later gold rallies failing at $1800. The HUI index started mimicking the gold price and the HUI/Gold regression was established as the new rule of thumb during summer 2012.
 |
| Gold (red, left scale in USD/Oz) and HUI (blue, right scale); Data from Jan 2011 till till Oct 10, 2017 - click to enlarge |
Analysis of the residuals
While the trend line gives an overall decent fit, data points in the intermediate area are scarce and seem to concentrate on the downside, while the data cloud at the right is quite extended. For a meaningful explanation, we need to introduce the dates once again, showing the 'residuals' as a function of time. These distances from the least squares trend graph are shown as a function of time on the below graph: |
| Residuals as a function of time from May 2012 till Oct 10, 2017 (click to enlarge) |
 |
| Residuals as a function of time from July 1, 2015 till Oct 10, 2017 (click to enlarge) |
Residuals remained positive from mid May 2016 (despite a late June plunge) throughout August 23. By mid August gold had started weakening, with the slide accelerating towards the end of the month. This eventually killed miner enthusiasm. Residuals remained negative after Aug 30 till Oct 12, later on they have been oscillating between +10 and -10 (more or less market neutral). Yet from mid November onward, miners have been anticipating the gold recovery has been materializing earlier. Miner sentiment peaked early January 2017. As gold strengthened till end February, enthusiasm for miners waned and residuals briefly turned negative. During the April gold recovery, peaking at $1280, miners kept lagging the yellow metal and residuals again turn negative, with little change as gold was weakening to around $1250. With gold unable to hold on to any substantial gain, miners are languishing. Sentiment even went sour as gold failed a last attempt to break above $1300 early June and residuals slid below -20. Remarkably residuals improved and returned to a neutral stance by mid June. After bottoming before mid July 2017, the gold price is recovering with miners following reluctantly. From a neutral stance, residuals plunge to -38 as gold eventually was peaking at $1350.
Residuals were approaching a neutral stance as gold turned around early October. Yet as the rally unfolds, miners once more lag the yellow metal and residuals slide back deeper into the red.
* * *
A caveat
A negative reading implies that mining investors on average accept selling their mining shares at lower prices than what the 'regression rule' suggests. At any positive reading, investors are ready to pay more. The sign and trend of the residuals is not meaningless at all. The below description is 'a caveat' against considering negative residuals a strong 'buy signal' for miners.A persistent negative reading sometimes is the prelude for a slide of the gold price. A 'textbook example' is shown in the graph below, where the residuals are plotted together with the gold price before and after the hectic gold sell-off in April 2013 continuing to June 2013.
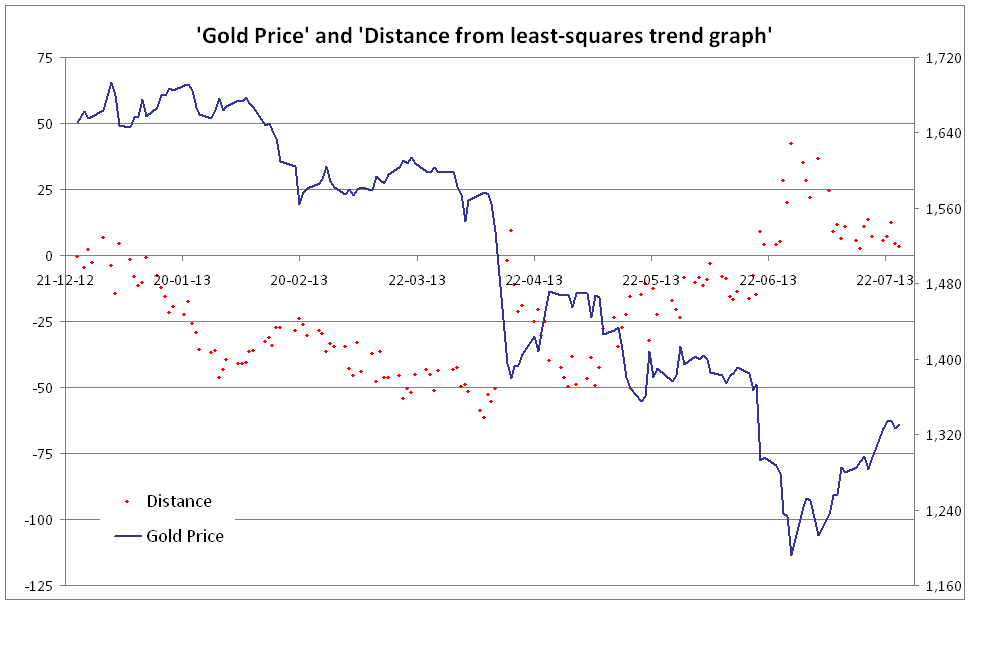 |
| Residuals (red dots, left scale) as a function of time from Christmas eve 2012 till July 26, 2013, The gold price in USD (blue graph) is shown on the right scale. (click to enlarge) |
As we head into 2013, the residuals turn negative, reaching an extreme over -50 in April, with gold near its $1560 support, shortly before the gold sell-off. It seems as though mining investors were 'sensing' what was going to happen. After the slide materialized, the residuals very briefly turned positive, yet they slid down again at the gold recovery above $1450. As gold sold off again in June, bottoming below $1200 for the first time since 2010, residuals turn up and become strongly positive. Did mining investors anticipate that these prices would not hold in the short run and that some (albeit temporary) recovery was looming? Apparently so.
And of course: since the model could be established and its parameters correctly estimated only long after the April 2013 gold price sell-off, any mining investor perception on potential gold price trend was purely intuitive. The negative reading of the residuals could not have been known nor assessed.
Earlier articles on this topic
- Gold relative to the Philadelphia Gold and Silver Miners index, June 9, 2016
- Gold Miner Rally: a bull market logic, May 9, 2016
- The bear market logic for gold miners: Continuation and Analysis, July 24, 2015
- Gold and the Miners: identifying the bear market logic, May 11, 2015
Later articles (on how the regression is breaking apart)
- Miners will continue to disappoint (Jan 26, 2019)
- Gold Miners persistently lagging the metal (Feb 12, 2018)
Hi Gwyde Team,
ReplyDeleteMy name is Anuj Agarwal. I'm Founder of Feedspot.
I would like to personally congratulate you as your blog Gwyde has been selected by our panelist as one of the Top 70 Gold Blogs on the web.
http://blog.feedspot.com/gold_blogs/
I personally give you a high-five and want to thank you for your contribution to this world. This is the most comprehensive list of Top 70 Gold Blogs on the internet and I’m honored to have you as part of this!
Also, you have the honor of displaying the badge on your blog.
Best,
Anuj