Last two years, we've witnessed a plunge of precious metal prices from before Christmas leading to the New Year. The relentless gold bear raids from mid April onwards, lead to a multi year low for gold on June 28 and the following recovery completely was wiped out with gold equalling the June 28 low on Thursday Dec 19. It seems the gold bear has gotten ahead of itself.
We have only five list components still holding firm since Nov 19 of 2010. Tahoe (THO) is the best pick with a gain of 75,6%. First Majestic Silver comes in fifth, still holding on to a tiny 4.1% gain. Aurico Gold (previously Gammon Gold) closes the top 20% series, facing a 40% loss.
Returning even further into the 20th century is possible. The Philadelphia gold and silver miners index (XAU) goes back to December 1983 and Barron's gold miners index beats all, with data going back to before WW-II. For such very long time range articles I refer to: Gold miners: three decades for naught (Jan 2015) or Decades of underperformance (Feb 2011).
Much the same accounts for the miners, which ceased to leverage down precious metal prices last week and were vigorously reviving, despite meager gains for the metals. Over the short trading week leading to Friday Dec 27, gold added a timid 0.86% on the Comex close to end at $1213.80, while -after its major plunge- silver added 3.43% closing at 20.08. The HUI index of major gold and silver miners added 4.23% with the HUI/Gold ratio now up to 0.1633, hovering above its decade low.
HUI relative to Gold
What you've been reading above, is my view on the present situation of the gold (or precious metals) markets and the response of the major miners upon the gold price fluctuations. But you're expecting more. In previous trend analysis of precious metal miners, I've been showing graphs of the HUI index of unhedged gold stocks quoting on American exchanges, relative to the gold price itself. An analysis of this ratio over a short (6 months) time frame is updated weekly on the GoldMinerPulse blog page. Below you find the graph, with daily observations from end June to Dec 27.
 |
| HUI/Gold ratio, daily observations over six months ending on December 27, 2013 - Click to enlarge |
The technical recovery after the June 26 low for miners is shown to fail rapidly as the precious metals hesitate after an initial bounce. By early August the ominous summer dolldrums seem to take their toll, with miners plunging and HUI/Gold coming close to its June 26 low. Once more we're bailed out by the August gold rally, taking the HUI/Gold ratio back up to 0.200, a level previously considered a solid bottom, but now apparently becoming a tough resistance. The mid September 'no tapering' FED announcement caused but a short upward blip after valuations had come down upon gold failing to uphold the $1400 level attained during the August rally. Gold breaking below $1300 early October caused the HUI/Gold ratio to set a fresh low, with a double dip to 0.166 on Oct 8 and 11. A timid recovery brought bullion back up above $1350 with miners responding favourably and the HUI/Gold recovering some territory lost. By end October we were back up above 0.18 on the HUI/Gold ratio. Yet the early November correction turned into another slide for precious metals, with the eternally touted tapering saga backing short sellers. Gold broke below $1250 on Nov 20 and the HUI/Gold ratio didn't take long to break below its October bottom. Despair crept into the minds of mining investors. Even a tiny further decline of the gold price caused a major slide for miners, driving the HUI/Gold ratio into an unfathomable abyss. By December 6, HUI/Gold slid to 0.1566, a level not seen in over a decade. In fact, since the HUI index was first calculated in 1996, the 0.16 level was broken below only very briefly by the end of the 20 year bear market of precious metals, with gold quoting below $275.
The longer perspective
We now extend our time horizon to the beginning of 2013:
 |
| HUI/Gold ratio, daily observations year-to-date ending on December 27, 2013 - Click to enlarge |
The slide of HUI/Gold seems almost uninterupted, with the intermediate 'recoveries' reduced to temporay upward blips, by far not coming even near to regaining the territory lost. HUI/Gold started 2013 at a level of 0.267 on Jan 2, with gold quoting at $1685 and the HUI at 450.5. If the HUI would have declined proportionally to gold (-28% since Jan 2), it would quote at 324. Instead it has lost 56% to 198.2 on December 27: half of the decline of the HUI miners index is due to relative valuation imploding, while only the other half is due to the slide of the gold price.
In absolute terms the mid April slide of the HUI was most severe with the gold price breaking down from above $1560 to $1350 in only two days and the HUI losing almost 50 points or over 15%. Yet, the slide of HUI/Gold had been almost unabated leading up to the mid April massacre. It almost seems to have been ominous.
After the failed May recovery, the gold price slid to a three year low on June 28, while miner relative valuation bottomed two days before, posting its multi-year low which was tested several times before being broken in October.
We now move on to a three year time horizon, which takes us back to end 2010, over eight months before the yellow metal reached its peak price.
 |
| HUI/Gold ratio, weekly observations since Dec 2010 and ending Dec 27, 2013 - Click to enlarge |
It is disappointing to observe that the slide already set in during the 2011 spring, with the HUI completely unable to keep track with the rising gold price. In fact even at the very peak it reached in August, the HUI/Gold ratio was lower than where it started off in 2011. In 2012 we notice the May/July double bottom at 0.24, now far above the current level. The 2012 events are discussed in more detail in previous postings:
- Miners relative to precious metal prices - an update (Jan 2013) and
- Miners relative to precious metals: a tactical approach. (July 2012)
The July 2012 posting also includes a very long time perspective on HUI/Gold, from June 1996 onwards. It clearly puts the present analysis in a secular perspective and also demonstrates how exceptional the current HUI/Gold valuation really is.
Bonus content: HUI mining index relative to gold: two gold miner bear markets compared.
Bonus content: HUI mining index relative to gold: two gold miner bear markets compared.
How about silver miners?
Is the situation comparable? As a benchmark I use the SIL (Global-X silver miners ETF), which goes back just over three years against the silver price. You find the 6 month graph on the GoldMinerPulse
blog page. I start off with the graph year-to-date. Though equally cumbersome at first sight, there are some important differences to note. The SIL/Ag ratio occasionally quoted above its 200 dma during the brief rallies in 2013, moreover this 200 days moving average started the year flat, suggesting there was no real very long downtrend ongoing. The 50 dma was above the 200 dma as recent SIL/Ag valuations had been strong by the end of 2012. On the contrary HUI/Gold didn't ever come close to its declining 200 dma over 2013. At best is sometimes broke above its 50 dma.
So for SIL/Ag the 2013 trend has been down, yet it isn't the latter part of long lasting plunge the way we observed it for HUI/Gold! With both silver and the silver miners more volatile, some intra-day swings for SIL/Ag can be quite impressive, as shown by some of the longer whiskers in this candle stick chart.
 |
| SIL/Ag daily observations over 2013 ending Dec 27. (click to enlarge) |
The long time perspective shows that SIL/Ag fails to keep up with the parabolic rise of the silver price from January till April 2011, when the metal challenged its Jan 1980 price level. Though the silver price slid much more from its $48 high (it more than halved) than did the gold price, silver miners have not leveraged down to the same extent.
 |
| SIL/Ag: weekly observations over 2011-2013 ending Dec 27. (click to enlarge) |
Canadian miner database
Below you find an index chart since December of those miners and explorers included in the 'Canadian gold and silver mining' database. The blue graph is a cap weighed silver miners index; the black graph shows a cap weighed gold miners index, while the red one is an equal weight index of both gold and silver miners. Due to its simple weighing scheme, this index is slanted towards the performance of micro-cap and nano-cap juniors, which have the same weight and influence as have major miners in this type of index.
 |
| Cap weighed gold and silver miners indices and an equal weight index, with a clear emphasis on micro-cap and nano- cap juniors. All indices started at 1000 on Nov 19 of 2010. (click to enlarge) |
The silver miners index rose till 1400 in April 2011, peaking three weeks earlier than did the silver price. Despite a similar plunge as the gold index, it better withstood the cyclical silver bear market. This index is down little over 40% year to date.
After bottoming on June 26, the gold miners index had recovered, yet it is back down again taking out the June low by end November 2013, while further dragging along in December. This index is down 48% year-to date. The equal weight index is the victim of the fate of explorers and junior miners, taken to the woodshed. This index lost 54% year to date. If all of the above don't seem excessive losses, also consider that the quotes are in Canadian dollar and the loonie has lost a few percent ever since the raw material bear market really went viral.
The individual miner stories
The gold miner pulse page includes a performance disparity chart, where all miners in the database are included on a single chart, sorted according to their long term stock performance. The very last graph is included below:
 |
| Performance disparity graph of all miners and explorers on the GMP list, base Nov 19, 2010 - Last updated on: Dec 27, click to enlarge |
There is an important performance disparity among the gold and silver miners of the GMP database. Too many laggards seem moribund. The median (or middle) miner (with an equal number better and worse) loses 75.07 %! What this implies is that we need a quadruple only to break even on the average gold miner !
Now 19 miners/explorers lose 90% or more, with 9 thereof down over 95%. The 3 worst:
- Telson Resources
- AM Gold
- Golden Minerals
At the right hand side you find barely 5 miners still quoting above their Nov 2010 mark, lead by Tahoe Resources, which saw its gains dwindle to 75.6%.
On a regular basis, I keep track of miners included in the 'Canadian gold and silver mining' database on another blog page: Miners' performance. It divides the about 100 Canadian miners and explorers or developers in five quintiles according to their share performance since I started monitoring them in November 2010. We now have a three year track record shown in each of the graphs.
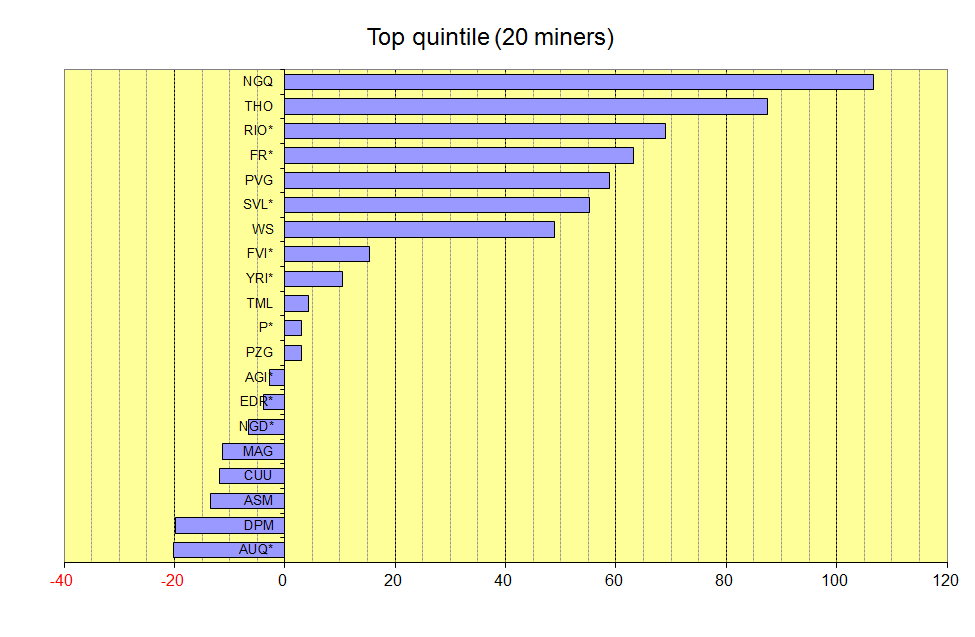
The below graphs give an overview of the top quintile: the 20% best miners among the herd. The symbols in the bar chart are the quotes on the Canadian TSX. If you're not familiar with them, the company names with their quotes are listed on the Miner's performance page. We start off with the situation on Sept 12, 2014 (updated) and gradually go back in time to Jan 27 of 2012.
Despite miners plunging along with precious metals since mid August 2014, the situation in the top quintile is not as dramatic as it was in December 2013. Gold is up only 3.2% year-to-date, while silver is even down 4.5%. We now have 12 explorers or miners keeping out of the red and gains on the top picks have improved significantly.
 |
| Top quintile: the best 20% of the miners included in the Gold Miner Pulse database on Sept 12, 2014 |
 |
| Top quintile: the best 20% of the miners included in the Gold Miner Pulse database on Dec 27, 2013 |
 |
| Top quintile: the best 20% of the miners included in the Gold Miner Pulse database on Aug 26, 2013 |
 |
| Top quintile: the best 20% of the miners included in the Gold Miner Pulse database on Oct 30, 2012 |
 |
| Top quintile: the best 20% of the miners included in the Gold Miner Pulse database on Jan 27, 2012 |
What is most prominent is that on Dec 27, 2013 very decent gains have dwindled since less than two years before (Jan 27, 2012) and a majority of the top 20% now faces a loss over roughly three years time. Less than two years ago, the miner ranked 20 still enjoyed a gain in excess of 35%. It makes one thing clear: there is no place to hide, no good pick that protected you from the downturn.
There have been some demographic changes to the list. A few elements listed earlier on, got taken over (e.g. Extorre Gold was acquired by Yamana). Excellon is a newcomer in the list: it doesn't owe its favourable position due to rallying up out of nowhere. Further on there have been a few movers and shakers:
Some movers ...
- Tahoe Resources, a silver mine developer, moved up from position 8 to the top, while holding on to its Jan 27, 2012 gain by Dec 27, 2013.
- Yamana Gold moved up from position 18 to 10, but nevertheless turned a 35% gain in Jan 2012 into an 18% loss now.
- First Majestic Silver moved up from 7 to 5, but saw its gains dwindle from close to 90% to 4.1%.
- Primero Mining Corp. was outside the top 20% in Jan 2012, and made its appearance in the Oct 30 top 20% graph that year. It now has moved up to position 8, but nevertheless saw prior gains turn into a 14% loss.
... and some shakers
- Cream Minerals, now renamed to Agave Gold Minerals, lost its splendor and faces stiff losses.
- Sunward Resources quoted among the top picks in Jan 2012 and lower down the list by end Oct 2012; meanwhile it has slid to one of the underperformers with losses in excess of 80% since inclusion.
- Silver mining junior, Revett Minerals more or less went the same direction, but still upholds in the midrange quintile, avoiding total destruction.
- Explorer Wildcat Silver, the top pick on January 27, 2012 saw very decent gains turn to a loss, but nevertheless maintains a position among the best 20% of miners and explorers
Outlook for 2014
Repeatedly gold mining analysts have called the bottom in after miners got back on their feet again during any of past recoveries. On every occasion those recoveries have only been the prelude for another gold bear raid and miners being beaten up even worse than what they had been before. It's extremely tedious to call the bottom in, given those circumstances. Anyone doing so will be met in disbelief and the investor herd rather flocks around the doomsday preachers proclaiming the imminent end of the gold mining industry.
This more or less is the mindset needed for a true recovery to finally take root. Balancing both, I'm ending this posting with a rather cautious outlook, previously posted and still upholding with minimal change:
The protracted downtrend of precious metal prices may have run its course, there is however no clear indication of much higher gold and silver prices in the near or medium term future. Gold is moving sideways, unable to sustainably uphold any gain.
Producers are scrutinizing their mining sites and not without reason. Production at mines with high total production costs may need to be scaled back. Any new mining development will need to factor in lower gold prices going forward and the internal rate of return will be substantially lower. Especially on sites where investment costs have been spiralling out of control, tough decisions may have to be made. It should be clear that, unless the gold price sustainably recovers, bankruptcies among miners won't be exceptional any longer and the global gold mining output may ultimately start to decline. Gold mining: the fading away of an industry (?)
In these circumstances it is increasingly difficult to make any money investing in this sector. The "believers" may financially survive only when factoring in the above observations in their capital allocation:
1. Producing mining companies with low total production costs definitely are worth the extra to be paid (in terms of value per ounce of reserves or ounce produced).
2. A decent alternative are the established streaming companies, having a revenue stream depending on precious metal prices, but avoiding most specific mining risks.
3. Among explorer developers, it should be emphasized that only those with real world class deposits may thrive, provided they have the business oriented management team that may find capital at minimum dilution, keeping shareholders happy.
The days of expensive acquisitions of explorers by mining majors are behind us. Acquisitions tend to be more lucrative for the acquiring mining companies. This situation will continue until gold ultimately resumes a solid uptrend.
And finally: If I were convinced that we had the gold miner bear market behind us, "Post mortem of a gold miner bear market" would have been a more catchy title. We aren't there yet.
And finally: If I were convinced that we had the gold miner bear market behind us, "Post mortem of a gold miner bear market" would have been a more catchy title. We aren't there yet.
* * *
Further reading
Further reading
Several more articles, using this same approach, have been published:
- Miners relative to precious metals: a tactical approach; (July 2, 2012)
- Miners relative to precious metals: An update on 2012; (Jan 13, 2013)
- Three year slide of precious metal miners (Dec 31, 2014)
Nice blog
ReplyDeleteThank you,
Share Tips