The below graph shows the price of gold since the start of 2008, gold was about to break above $1000/oz for the first time in history. We all more or less remember what was to follow, but human memory is selective and often narrows down to the more recent events. Apart from the price of gold (in blue using the left axis), a second graph in red (using the right axis) shows an annualized measure of gold price volatility. It wants to tell a story...
Volatility is defined as the standard deviation on a series of daily percentage price changes. Annualized this gives a good idea of where the price of the precious metal may most likely end up within one year. If volatility is low, the perceived uncertaintly of the future price is limited. Whenever volatility swings up, expectations about the future price level tend to diverge.
On any market, volatility is oscillating up and down as the pace of daily price changes also fluctuates. Volatility seems to have a "base level" it most often returns to, but seldom breaks below. For gold this seems to be some 10%. Volatility peaks occur both during the last phase of gold rallies as during swoons. Now what's peculiar is that volatility doesn't return to its "base level" after the first few peaks prior to a major volatility surge. This has been observed both for any stock market index as for precious metal prices. (See below: 1-3)
An illustration: During the run-up of gold to $1000, volatility is on the rise. It then drops back but doesn't return to its base level. Another volatility swing peaks at 40% and again it drops back going barely below 20% when the final volatility surge in autumn 2008 brings gold price volatility to over 50%. It doesn't cool down till early summer 2009. Volatility troughs only get back to the "base level" well into 2010. (Note: Data and a graph from 2000 onwards are to be found in the first article referenced below.)
As gold breaks below its 2-year support around $1550 back in April 2013, volatility surges. It barely has the time to cool down in May as a second selling spree makes the gold price volatility peak again end June as the metal nosedived below $1200. The frequent alternations of failed rallies (as in August) and new price swoons (as earlier this month) caused another volatility peak. What's important is that the gold price volaitility did not return to its "base level" on any occasion for six months. The higher troughs let expect a major gold price volatility spike anytime during the months to come.
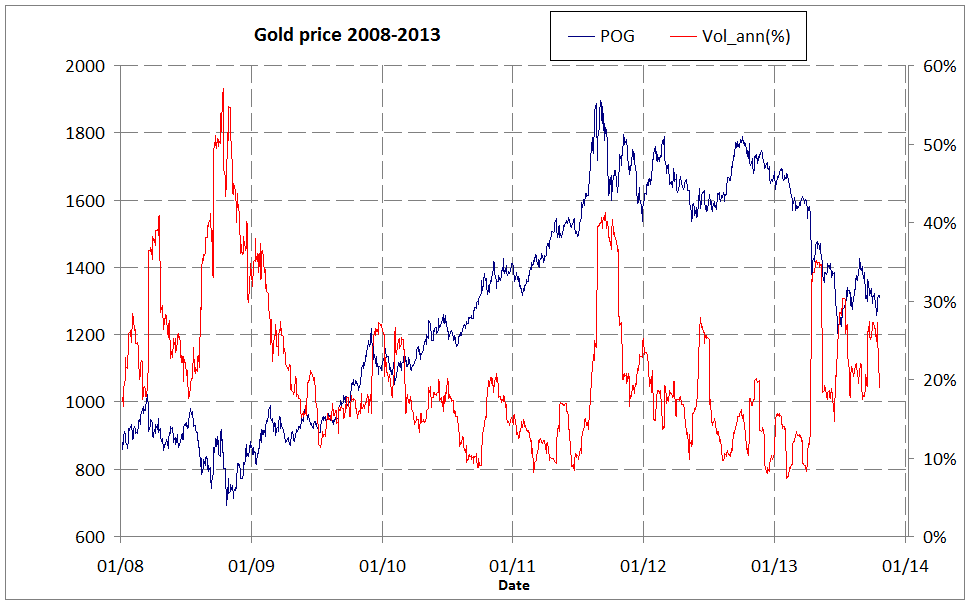 |
| Price of gold (blue, left axis) and gold price volatility (red, right axis) Data from Jan 2008 onwards till today - click to enlarge |
On any market, volatility is oscillating up and down as the pace of daily price changes also fluctuates. Volatility seems to have a "base level" it most often returns to, but seldom breaks below. For gold this seems to be some 10%. Volatility peaks occur both during the last phase of gold rallies as during swoons. Now what's peculiar is that volatility doesn't return to its "base level" after the first few peaks prior to a major volatility surge. This has been observed both for any stock market index as for precious metal prices. (See below: 1-3)
An illustration: During the run-up of gold to $1000, volatility is on the rise. It then drops back but doesn't return to its base level. Another volatility swing peaks at 40% and again it drops back going barely below 20% when the final volatility surge in autumn 2008 brings gold price volatility to over 50%. It doesn't cool down till early summer 2009. Volatility troughs only get back to the "base level" well into 2010. (Note: Data and a graph from 2000 onwards are to be found in the first article referenced below.)
As gold breaks below its 2-year support around $1550 back in April 2013, volatility surges. It barely has the time to cool down in May as a second selling spree makes the gold price volatility peak again end June as the metal nosedived below $1200. The frequent alternations of failed rallies (as in August) and new price swoons (as earlier this month) caused another volatility peak. What's important is that the gold price volaitility did not return to its "base level" on any occasion for six months. The higher troughs let expect a major gold price volatility spike anytime during the months to come.
References:
- Volatility in the gold market, May 7, 2013
- Risk mispricing, May 13, 2012
- Volatility persists, Nov 16, 2010
No comments:
Post a Comment